

In a groundbreaking study conducted by Betting.com, a comprehensive analysis of NBA injury reports from 2010 to 2020 has revealed intriguing insights into the injury landscape across various courts. This study, which meticulously examined 25,000 injury reports, sheds light on the patterns and trends of player injuries over the past decade. Let’s dive into the revelations that have emerged from this comprehensive research.
The Data: A Glimpse into a Decade of NBA Injuries
Betting.com embarked on a monumental task – dissecting a decade’s worth of NBA injury reports, from 2010 to 2020, in order to unearth the most injury-prone courts. The research meticulously studied 24,894 instances of injuries reported on game days within the NBA. The depth of this analysis allows us to gain a profound understanding of how player health has evolved over the years.
The Peaks and Valleys: Yearly Injury Trends
The study highlights a rollercoaster ride of injury instances over the decade. 2017 stands out as the most injury-ridden year, witnessing a staggering 3000 reported instances of players being sidelined due to injuries. However, the narrative took a turn just two years later, as 2019 marked a decade-low with only 1900 players recording injuries. This significant drop in injury instances begs the question: What factors contributed to this decline in just a span of two years?
Unveiling the Champions of Injury Rates: The Top 3 Offenders
When it comes to the most injury-prone courts in the NBA, the results of the study have brought some intriguing names to the forefront.
- AT&T Center – San Antonio Spurs’ Home Turf (2.60 injuries per game): Securing the unenviable top spot, the AT&T Center earned the notorious distinction of having the highest injury rate in the NBA. With a staggering average of 2.60 players falling victim to the injury curse per game, the San Antonio Spurs’ home court has posed significant challenges to player health.
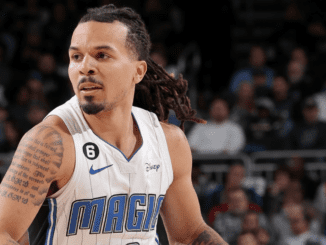
- Kaseya Center – Miami Heat’s Home Arena (2.27 injuries per game): Following closely in second place, the Kaseya Center, home to the Miami Heat, has witnessed 970 reported injuries across the decade. With an average of 2.27 injury reports per game, this arena has proved to be a tough battleground for player well-being. Interestingly, during the Heat’s championship runs in 2020 and 2023, key players like Goran Dragić, Bam Adebayo, and Victor Oladipo suffered injuries, underscoring the impact of injuries even during highly competitive periods.
- Barclays Center – Brooklyn Nets’ Home Court (2.15 injuries per game): The Barclays Center rounds out the top three, with an average of 2.15 injuries reported per game played in Brooklyn. This iconic court has seen its fair share of injury-related challenges for players.
A Breath of Fresh Air: The Safest Arena in the NBA
While some arenas were marred by high injury rates, there is one shining beacon of player well-being:
- New Orleans Pelicans’ Arena (1.19 injuries per game): The New Orleans Pelicans’ arena emerged as the undisputed champion of player safety. With an astonishing record of just 1.19 injuries per game.
The Full List: A Glimpse of All Arenas Ranked by Injury Rates
Here’s the complete list of NBA arenas ranked by injury rates:
- AT&T Center – 2.60
- Kaseya Center – 2.27
- Barclays Center – 2.15
- Firesev Forum – 2.12
- American Airlines Center – 2.12
- Scotiabank Arena – 2.11
- Toyota Center – 2.05
- TD Garden – 2.04
- Chase Center – 2.02
- Ball Arena – 1.98
- Rocket Mortgage FieldHouse – 1.91
- Wells Fargo Center – 1.88
- Capital One Arena – 1.87
- Madison Square Garden – 1.86
- Vivint Arena – 1.84
- State Farm Arena – 1.82
- Target Center – 1.82
- Gainbridge Fieldhouse – 1.80
- FedExForum – 1.79
- Amway Center – 1.75
- Staples Center – 1.74
- Golden 1 Center – 1.62
- United Center – 1.57
- Paycom Center – 1.57
- Little Caesars Arena – 1.44
- Footprint Center – 1.43
- Moda Center – 1.42
- Spectrum Center – 1.33
- Smoothie King Center – 1.19
Conclusion: Insights That Shape the Game
The Betting.com study has brought to light a decade’s worth of injury data that offers valuable insights into the NBA’s injury landscape. From the highs of 2017’s injury instances to the lows of 2019, the patterns that have emerged challenge us to explore the factors influencing player health. As the NBA continues to evolve, these findings provide a crucial foundation for teams, players, and arenas to prioritize player well-being and ensure that the game thrives on healthy competition. Even during championship runner-up runs, like the Miami Heat’s in 2020 and 2023, the specter of injuries remains a significant factor in shaping the outcomes of games and seasons.
For more sports coverage from MLB, NBA, NFL, to NCAA contact Julian Ojeda: Call 786-501-9082 | Email: julianojeda@wepa.fm
To stay tuned for more Sports Reports follow @jowepafm on Twitter

Be the first to comment