

In the dynamic world of the NBA, where every point and tactic can make or break a game, the question of fair play often arises. Betting.com, in its pursuit of statistical insights, has undertaken an extensive league-wide study to unravel which NBA teams consistently commit the most and fewest personal fouls. Through an in-depth analysis of over 40 years of data sourced from the NBA API and basketballreference.com, this study shines a light on the teams that have shown exceptional discipline and those who’ve leaned towards a more aggressive playing style.
Defining Fair Play: Analyzing Fouls Per Game
To assess the fairness of NBA teams, Betting.com meticulously compiled and examined data from a variety of sources, including the NBA API and basketballreference.com. The metric of ‘fouls per game’ was employed, considering the variations in season lengths, to determine which teams consistently strived to avoid rule-breaking.
Hornets Claim All-Time Fairest Season
The analysis reveals that the Charlotte Hornets stand out as the fairest team during a single season, with an impressive 16.585 fouls per game in the year 2016. Notably, the Los Angeles Lakers and the San Antonio Spurs also maintained low foul rates during the 2011 and 2017 seasons, respectively.
| Team | Fouls Per Game | Year |
|---|---|---|
| Charlotte Hornets | 16.585 | 2016 |
| Los Angeles Lakers | 16.803 | 2011 |
| San Antonio Spurs | 17.171 | 2017 |
| Orlando Magic | 17.181 | 2020 |
| Charlotte Hornets | 17.183 | 2017 |
| Chicago Bulls | 17.258 | 2011 |
| Milwaukee Bucks | 17.278 | 2020 |
| San Antonio Spurs | 17.318 | 2011 |
| San Antonio Spurs | 17.402 | 2012 |
| San Antonio Spurs | 17.476 | 2015 |
San Antonio Spurs: Masters of Fairness
The San Antonio Spurs emerge as key players in the realm of fair play, claiming four spots within the top ten fairest seasons. Their 2011, 2012, 2015, and 2017 seasons showcased a disciplined approach, each with fewer than 17.5 personal fouls per game. This commitment paid off, as three of these seasons led to conference semi-finals appearances, while their 2012 season nearly secured them an NBA championship.
Fair Play and Championship Success
A trend emerges from the data, emphasizing a strong correlation between fair play and championships. The Hornets, though committing the fewest personal fouls across a decade, were unable to clinch a championship. On the other hand, teams like the Celtics, Rockets, Spurs, and Bucks secured multiple championships during their fair play prime.
Kings and Knicks Tie for Personal Foul Record
Interestingly, the Kansas City Kings and the New York Knicks share the dubious distinction of having the highest personal foul average in a single season. In both the 1982 and 1984 seasons, these teams averaged 29.210 fouls per game.
| Team | Fouls Per Game | Year |
|---|---|---|
| Kansas City Kings | 29.210 | 1982 |
| New York Knicks | 29.210 | 1984 |
| Seattle SuperSonics | 29.020 | 1987 |
| New York Knicks | 28.790 | 1987 |
| San Diego Clippers | 28.700 | 1981 |
The Fairest and Dirtiest of Each Decade
The comparison of fair play and foul rates across decades is intriguing. Notably, the Boston Celtics maintained a commendable fair play record in the 1980s, while the Kansas City Kings stood out as the team with the highest foul rate during the same period.
| Decade | Fairest | Fouls Per Game | Dirtiest | Fouls Per Game |
|---|---|---|---|---|
| ‘80s | Boston Celtics | 22.55 | Kansas City Kings | 27.16 |
| ‘90s | Houston Rockets | 20.68 | Denver Nuggets | 24.01 |
| ‘00s | San Antonio Spurs | 19.80 | Utah Jazz | 24.34 |
| ‘10s | Charlotte Hornets | 17.97 | Phoenix Suns | 21.78 |
| ‘20s | Milwaukee Bucks | 17.85 | Detroit Pistons | 21.52 |
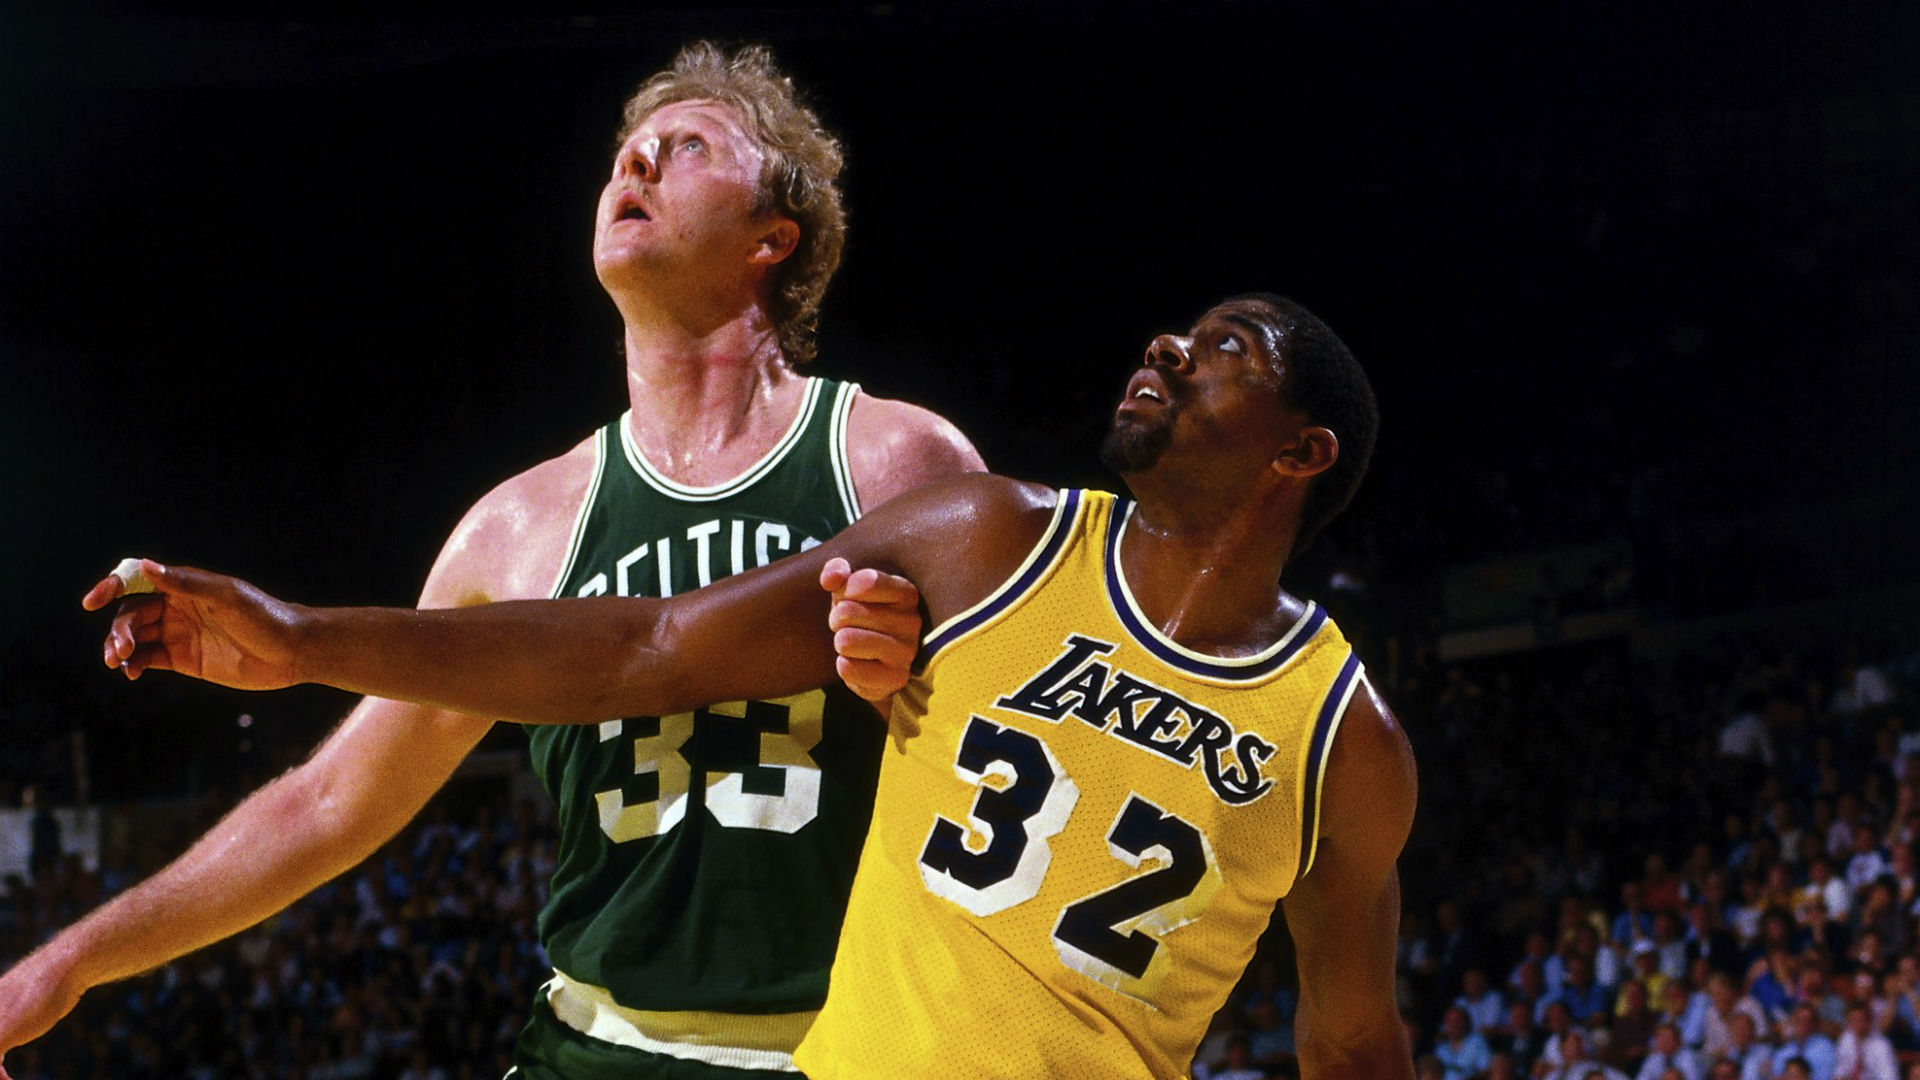
Myth Debunked: Larry Bird’s Celtics and the “Bad Boy Pistons”
The infamous rivalry between Magic Johnson’s “Showtime” Lakers and Larry Bird’s Celtics often portrayed Bird’s team as the rougher side. However, the numbers reveal a different story – Bird’s Celtics committed fewer personal fouls per game than the Lakers. Similarly, the Detroit Pistons, despite their notorious “Bad Boys” reputation, maintained an average foul rate that was only marginally higher than the league average during their championship years.
Evolution of the Game: Changing Foul Averages
The landscape of NBA play has evolved significantly over the past four decades, accompanied by shifts in playing styles and strategies. As the three-point shot gains prominence, personal foul averages have seen a remarkable decline. From an average of 24.69 fouls per game in the 1980s, the NBA now witnesses an average of 19.64 fouls per game in the 2020s. This shift reflects a changing approach and a decreased physicality in modern gameplay.
For more sports coverage from MLB, NBA, NFL, to NCAA contact Julian Ojeda: Call 786-501-9082 | Email: julianojeda@wepa.fm
To stay tuned for more Sports Reports follow @jowepafm on Twitter
Be the first to comment